
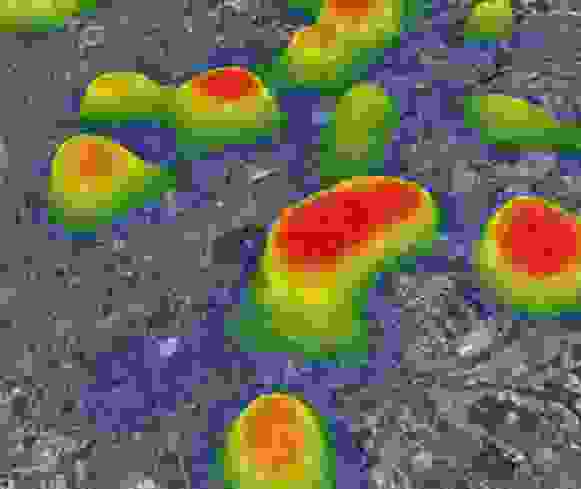
3D热力图
3D Heat Map
你将学到什么
- Cesium Viewer 初始化
- Cesium 影像图层
- Cesium 动态材质属性
- 热力图可视化
效果说明
热力或密度可视化,通常把数值映射到颜色/高度。
扩展功能 · Cesium.js
核心概念
Viewer 封装地球、相机、图层;可关闭 animation/timeline 等 UI 精简界面。
ImageryLayer 叠加 XYZ/WMTS/ArcGIS 等底图,
imageryLayers.add/remove管理。MaterialProperty 支持 CallbackProperty 时间动态材质。
密度数据映射颜色,可贴地或贴模型表面。
实现步骤
- 初始化
Cesium.Viewer与底图图层 - 添加 Entity / Primitive / DataSource 等业务对象
- 按需
camera.flyTo定位视角
代码要点
StoreClosure()— 案例中的独立逻辑模块,建议在线编辑器中跳转阅读Store()— 案例中的独立逻辑模块,建议在线编辑器中跳转阅读Canvas2dRendererClosure()— 案例中的独立逻辑模块,建议在线编辑器中跳转阅读Canvas2dRenderer()— 案例中的独立逻辑模块,建议在线编辑器中跳转阅读RendererClosure()— 案例中的独立逻辑模块,建议在线编辑器中跳转阅读HeatmapClosure()— 案例中的独立逻辑模块,建议在线编辑器中跳转阅读
源码
js
import {
  EllipsoidSurfaceAppearance,
  GeometryInstance,
  Material,
  Primitive,
  Rectangle,
  RectangleGeometry,
  SingleTileImageryProvider,
  ImageryLayer,
  ImageMaterialProperty,
  Entity,
} from "cesium";
import * as Cesium from "cesium";

/* ----------------------------------------------------heatMap类----------------------------------------------- */
var HeatmapConfig = {
  defaultRadius: 40,
  defaultRenderer: "canvas2d",
  defaultGradient: {
    0.25: "rgb(0,0,255)",
    0.55: "rgb(0,255,0)",
    0.85: "yellow",
    1.0: "rgb(255,0,0)",
  },
  defaultMaxOpacity: 1,
  defaultMinOpacity: 0,
  defaultBlur: 0.85,
  defaultXField: "x",
  defaultYField: "y",
  defaultValueField: "value",
  plugins: {},
};
var Store = (function StoreClosure() {
  var Store = function Store(config) {
    this._coordinator = {};
    this._data = [];
    this._radi = [];
    this._min = 0;
    this._max = 1;
    this._xField = config["xField"] || config.defaultXField;
    this._yField = config["yField"] || config.defaultYField;
    this._valueField = config["valueField"] || config.defaultValueField;

    if (config["radius"]) {
      this._cfgRadius = config["radius"];
    }
  };

  var defaultRadius = HeatmapConfig.defaultRadius;

  Store.prototype = {
    // when forceRender = false -> called from setData, omits renderall event
    _organiseData: function (dataPoint, forceRender) {
      var x = dataPoint[this._xField];
      var y = dataPoint[this._yField];
      var radi = this._radi;
      var store = this._data;
      var max = this._max;
      var min = this._min;
      var value = dataPoint[this._valueField] || 1;
      var radius = dataPoint.radius || this._cfgRadius || defaultRadius;

      if (!store[x]) {
        store[x] = [];
        radi[x] = [];
      }

      if (!store[x][y]) {
        store[x][y] = value;
        radi[x][y] = radius;
      } else {
        store[x][y] += value;
      }

      if (store[x][y] > max) {
        if (!forceRender) {
          this._max = store[x][y];
        } else {
          this.setDataMax(store[x][y]);
        }
        return false;
      } else {
        return {
          x: x,
          y: y,
          value: value,
          radius: radius,
          min: min,
          max: max,
        };
      }
    },
    _unOrganizeData: function () {
      var unorganizedData = [];
      var data = this._data;
      var radi = this._radi;

      for (var x in data) {
        for (var y in data[x]) {
          unorganizedData.push({
            x: x,
            y: y,
            radius: radi[x][y],
            value: data[x][y],
          });
        }
      }
      return {
        min: this._min,
        max: this._max,
        data: unorganizedData,
      };
    },
    _onExtremaChange: function () {
      this._coordinator.emit("extremachange", {
        min: this._min,
        max: this._max,
      });
    },
    addData: function () {
// ... 完整源码见在线案例编辑器
小结
扩展功能 · Cesium.js